

Why PDR Market Forecasts Disagree—and What Texas Shops Can Actually Use
Executive takeaway
Published PDR forecasts cover different businesses, use different years, and sometimes contain unresolved inconsistencies. Two reports estimate the 2025 global service market at $1.4 billion and $8.9 billion. That gap documents disagreement, not a usable consensus range. North American shares cluster more closely, but none of the supplied sources measures Texas PDR revenue. Texas shops, vendors, and investors should check segment, year, geography, and source quality before using any estimate. Hail-demand commentary provides context, not a verified statewide market value.
Before sizing PDR, decide what counts
For a Texas dent-repair business, the first question is practical: which market estimate describes your operation? Repair shops, tool suppliers, and software providers may serve the same industry, but they sell different things.
Paintless dent repair, or PDR, removes dents while preserving the vehicle’s existing paint finish. A useful market comparison must distinguish repair work from equipment, software, and broader automotive services.
Four reported 2024 global baselines show why those distinctions matter:
- Repair kits and tools: $1.32 billion. The kits market report measures equipment, not repair labor. Its estimate therefore addresses a different opportunity from a repair shop’s service market.
- Network management software: $1.18 billion. The network management report covers software connecting repair operations and insurers. It describes supporting technology rather than dent-repair revenue.
- Mobile PDR services: $4.1 billion. The mobile PDR report focuses on repairs delivered at the customer’s location. That delivery model narrows its scope relative to PDR services generally.
- Mobile automotive paint repair: $6.9 billion. The mobile paint repair report includes PDR within a broader category. Its total should not be presented as dent-repair revenue alone.
Separately, the PDR service market report gives an $8.9 billion baseline for 2025, not 2024. Both its service scope and its baseline year distinguish it from the preceding estimates.
Scope figure caption: The estimates differ in market definition and baseline year. The greater-than-sevenfold comparison spans $1.18 billion in network software in 2024 and $8.9 billion in repair services in 2025. It does not isolate scope’s effect alone.
These categories should not be added together to create a larger “PDR market.” Mobile PDR may overlap broader service estimates, while mobile paint repair explicitly includes PDR. Software and tools measure purchases distinct from the repairs themselves.
For Texas operators, matching business activity comes before interpreting the headline total. These global estimates provide category context, not a measure of revenue available to a Texas shop.
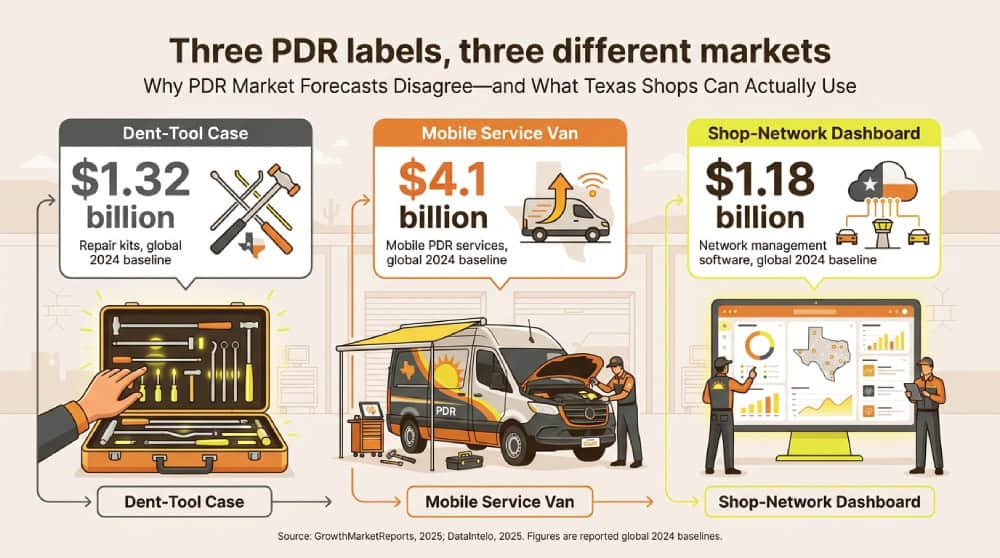
Source: GrowthMarketReports, 2025; DataIntelo, 2025. Figures are reported global 2024 baselines.
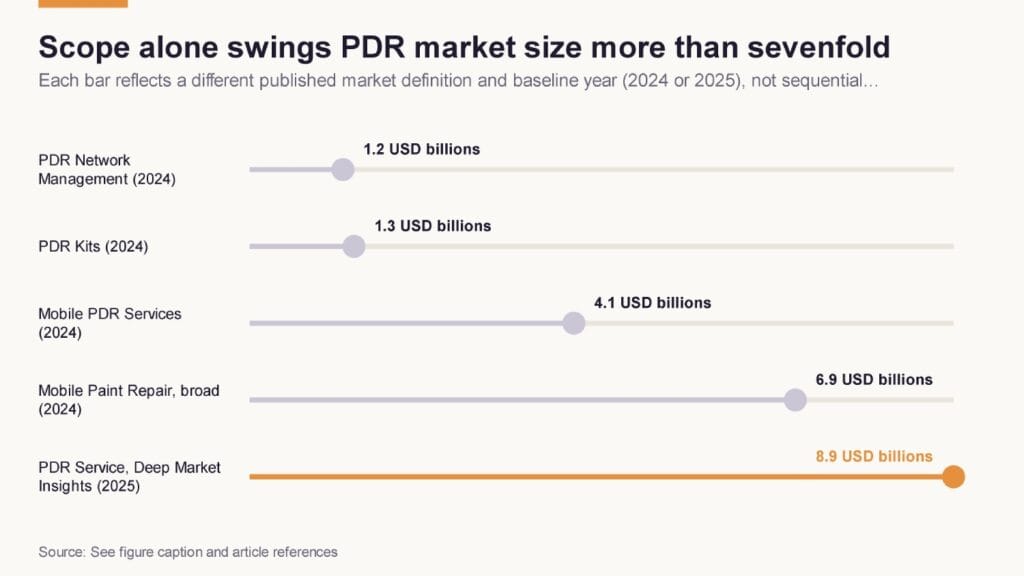
Ranking five published PDR-adjacent market sizes shows that definition, not time, explains most of the spread between reports. Method: Values are the most recent stated baseline (2024 or 2025) for each distinct market definition, taken directly from each report’s headline figure.
The same service label produces a 6.4-fold gap
Two published 2025 PDR service estimates differ by roughly 6.4 times. Worldwide Market Reports puts the global market at $1.4 billion.
Deep Market Insights estimates $8.9 billion for the same year under a similar service label. The 6.4-fold difference is calculated, not reported by either publisher: $8.9 billion divided by $1.4 billion equals approximately 6.36.
Holding the year constant rules out different baseline years as the explanation for this particular gap. However, similar labels do not establish identical coverage of activities, businesses, or transactions.
The baseline comparison figure places those two estimates alongside three others:
- HTF Market Intelligence: $4.1 billion, 2025. Its PDR service estimate falls between the two, but that position does not validate it.
- GrowthMarketReports: $3.33 billion, 2025. Its broader PDR market estimate provides context rather than a clean service-only comparison.
- Research and Markets: $2.17 billion, 2026. Its service-market estimate belongs to the following year, not the 2025 baseline group.
Baseline figure caption: Five estimates illustrate disagreement across publishers. The comparison includes a broader PDR category and a 2026 service estimate; it is not exclusively a same-year service comparison. Read it as a map of disagreement, not a consensus range.
The supplied summaries do not establish why the central service estimates diverge so sharply. Coverage and estimation methods could contribute, but neither explanation is verified. An intermediate estimate cannot resolve that uncertainty merely by lying closer to the middle.
A headline average would conceal measurement differences rather than resolve them. Before combining estimates, readers would need compatible definitions, years, and methods. Without that foundation, these global figures document publisher disagreement—not local revenue potential.
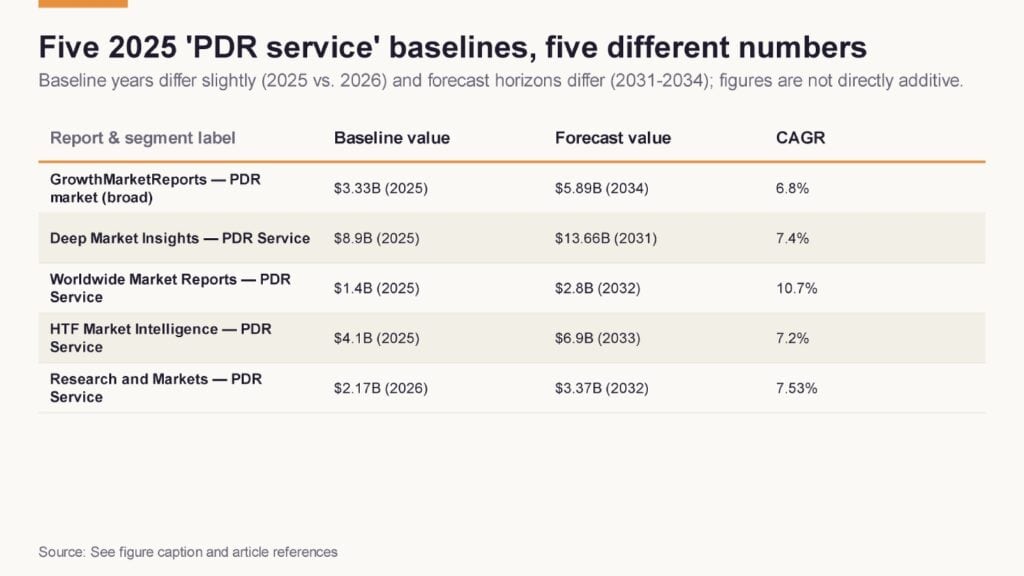
Five market reports price PDR around the same year but land on baseline values ranging from $1.4 billion to $8.9 billion. Method: Rows list each report’s stated baseline value, nearest forecast-year value, and CAGR, using the segment label each publisher assigned.
Check the report before trusting the forecast
A report should reconcile its own figures before its forecast guides a business decision. Check whether the headline, summary, and projections use consistent values, dates, and units.
The supplied summary of Market Report Analytics’ service report illustrates this problem. It presents an estimated $2.5 billion market, a separate $3 billion global figure, and “USD XXX million as of 2022.”
Without an explanation of their dates or scope, those statements leave the market size unresolved. The unfinished placeholder is a quality-control warning. It does not prove automated authorship or show that every finding is wrong.
Growth forecasts require a separate check. Compound annual growth rate, or CAGR, expresses the constant annual rate connecting a starting value to an ending value. It summarizes projected change rather than predicting the same growth rate in every intervening year.
Verified Market Reports gives a $1.28 billion tools-market baseline for 2026 and projects 9.51% CAGR through 2034. The supplied summary also states 8.2% for 2026–2033. These different windows mean the rates are not necessarily contradictory, but their relationship needs clarification.
By comparison, Research and Markets estimates $1.5 billion for 2025 and projects 4.4% CAGR through 2032. That rate is less than half Verified’s 9.51%, despite closely matching tools-market titles.
Different forecast windows could contribute to the divergence. The supplied evidence cannot separate timing effects from differences in scope, assumptions, or methods. Matching titles do not establish matching measurements.
As an explicitly earlier-window comparison, Technavio’s tools-market forecast projects a $447.3 million increase over 2023–2028, at 5.56% CAGR. That dollar figure represents additional revenue, not total market size. Comparing it directly with billion-dollar baselines would confuse a change in value with the value itself.
These examples suggest concrete questions for publishers: What activities count? Which forecast window applies? How do apparently conflicting figures relate? Until those questions are answered, the estimates remain claims requiring clarification—not interchangeable inputs for equipment purchases, staffing, or revenue targets.
North America’s share looks steadier—but only relatively
North America’s reported shares cluster more closely than the global totals, but they do not establish consensus. The supplied estimates range from 34% to 38% across different market categories.
The PDR service market report assigns North America a 34% share. It also reports that the United States accounts for 28% of global PDR service demand.
The broader paintless dent repair market report gives North America a 36.2% share. Its broader label limits direct comparison with the service estimate.
The mobile PDR services report reports 38% for North America. This estimate concerns a particular delivery model, not necessarily all PDR services.
The network management report also reports 38%. Agreement with the mobile-services figure does not make software and repair services equivalent markets.
The spread from 34% to 38% is four percentage points, not four percent. It appears modest beside the roughly 6.4-fold difference between the two 2025 service estimates. Yet similar regional shares applied to different global totals still produce different regional values.
Nor do these percentages independently validate one another. Their agreement would carry more weight if their definitions, periods, and methods were compatible. The supplied evidence does not establish that compatibility.
The US figure permits a conditional calculation, not a verified country breakdown. If the 28% US share and 34% North American share measure the same quantity against the same global denominator, dividing 28 by 34 yields approximately 82%. Under those assumptions, that would represent the US portion of North America.
This calculation provides no evidence about how US activity divides among states. A Texas estimate still requires a supported state allocation within the same market definition.
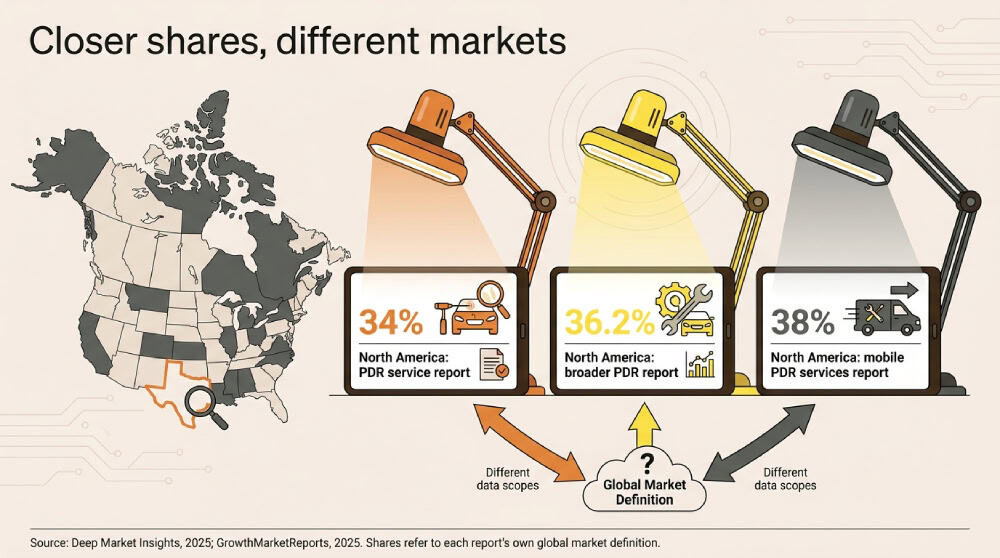
Source: Deep Market Insights, 2025; GrowthMarketReports, 2025. Shares refer to each report’s own global market definition.
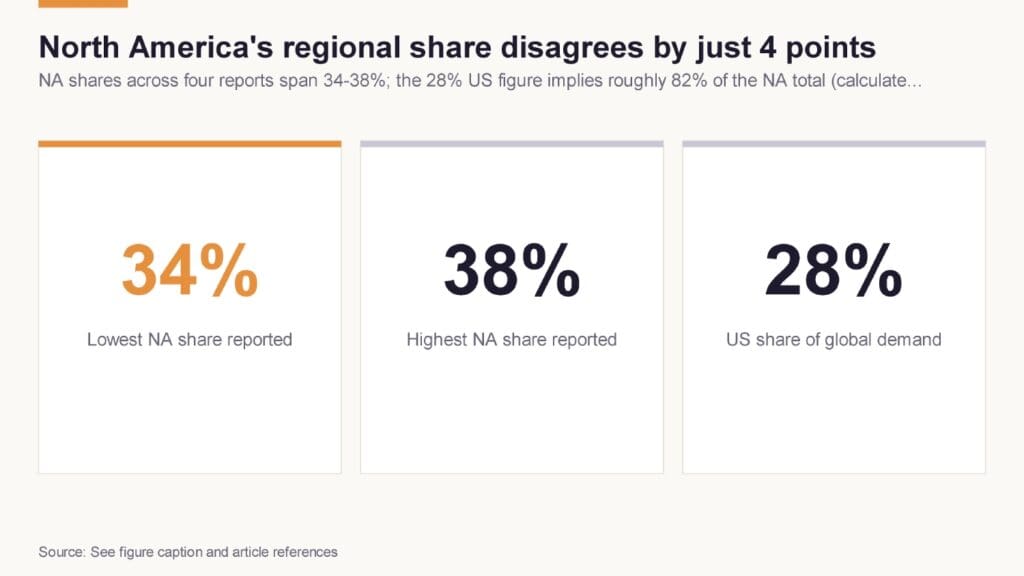
Unlike global dollar totals, North America’s share of the PDR market clusters tightly across four independent reports. Method: Lowest and highest reported North America shares were compiled across four reports; the separately stated US share comes from the same report as the lowest NA figure.
Texas has a hail-demand story, not a verified market total
None of the supplied sources assigns Texas a PDR revenue figure. They describe Texas as a location associated with hail-related demand, not a separately measured market.
Market Report Analytics describes higher service concentration in hail-prone regions, including Texas. This is a qualitative geographic claim, not a measured relationship between storms and sales. The summary’s unresolved numerical inconsistencies also warrant caution when weighing its commentary.
Deep Market Insights identifies frequent hailstorms in Texas, Colorado, Oklahoma, and Alberta as supporting North America’s market leadership. That explanation neither isolates Texas’s contribution nor measures the repair revenue generated by a particular storm.
The automotive dent-removal tools report connects hail events in Texas and Colorado with demand for mobile, rapid-response tools. This concerns equipment demand rather than a measured total for mobile repair services. It offers planning context, not a verified local growth rate.
More allocation steps do not make a Texas estimate more reliable. A top-down estimate would require a defensible global baseline and supported geographic shares. Each share must also use the correct denominator: a US share of global demand cannot serve as a US share of North America.
Even correctly structured arithmetic cannot supply missing evidence. Uncertainty in the global baseline carries into the result, while an assumed Texas allocation adds another weakness. Such a calculation would describe a scenario built from assumptions, not documented state revenue.
Missing evidence does not imply a small market. These sources cannot establish whether Texas revenue is large or small. Repeated mentions of hail repair exposure do not substitute for measuring the repair business.
A defensible local estimate would first define Texas PDR services. It should specify covered repair activities, treatment of mobile operators, and how revenue is assigned geographically. Those choices matter when operators travel between states.
The estimate would then need documented state-level revenue inputs for a stated period. Its method should explain coverage, exclusions, potential double counting, and treatment of unobserved businesses. Until those inputs exist, the supplied evidence supports a hail-demand narrative—not a verified Texas market total.
A four-step filter for better business decisions
A useful forecast must match the decision it supports, whether buying equipment, expanding a shop, or evaluating a franchise. Apply four checks before putting a PDR estimate into a budget or investment case.
- Define the segment before comparing totals. Establish whether the estimate measures repair services, tools, kits, software, or mobile paint repair. Shared terminology does not make those categories interchangeable.Vendors and franchisors should identify the precise market and baseline year behind sales claims. Investors should compare like-for-like segments before using market size to support valuations or expansion plans.
- Align the year and the measurement. Distinguish baseline estimates from forecasts, total revenue from incremental growth, and market size from geographic share. Reconcile different starting years and forecast horizons before drawing comparisons.Investigate unusually high or low growth projections rather than rejecting them automatically. Ask whether scope, timing, and assumptions explain the difference. No universal growth-rate cutoff establishes credibility.
- Confirm geography and look for a Texas breakout. Global and regional estimates do not establish statewide revenue. Keep qualitative hail-demand commentary separate from measured sales.As a practical recommendation, Texas shops should track local job counts, average invoices, customer origins, and hail-related versus routine work. Vendors, franchisors, and investors can request comparable operating records. Those records can inform business decisions, but individual firms do not represent the entire state.
- Inspect the source for internal consistency. Compare summaries, tables, dates, and forecast descriptions wherever available. Ask publishers to reconcile unexplained differences and disclose definitions, data coverage, and methods.Distinguish concrete defects from speculation about their cause. An unfinished placeholder warrants caution; it does not reveal how the research was produced. Likewise, internally consistent figures are not automatically accurate.
For Texas businesses, the goal is evidence matched to a specific decision—not a statewide forecast assembled from unsupported allocations. Useful market intelligence starts with a defensible definition, not the largest headline.
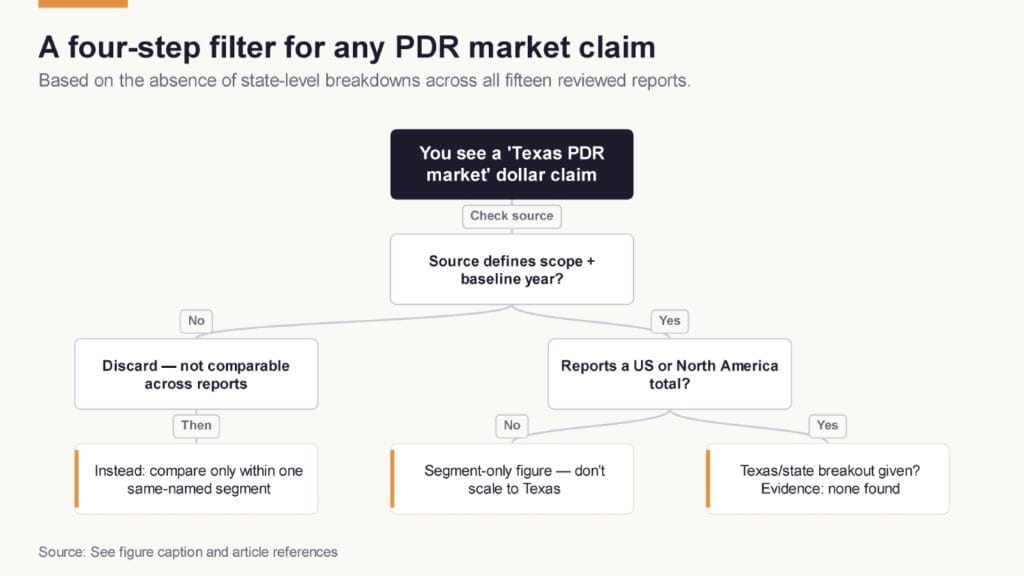
A practical guide for checking whether a published PDR market figure—including any Texas-specific claim—can be trusted at face value. Method: Tree logic mirrors the gaps identified across the reports: undefined scope, mismatched baseline years, missing regional shares, and the consistent absence of Texas-level data.
Limitations
- This analysis checks claims against supplied summaries of commercial reports, not their full text, underlying data, or methodologies.
- Several sources lack publication dates. Baseline years and forecast horizons differ, limiting direct comparisons.
- No supplied source reports Texas PDR revenue or establishes Texas’s share of national demand.
- Figure comparisons mix market segments and baseline years, including a 2026 service estimate. They illustrate disagreement rather than comparable measurements.
- Calculated ratios illustrate differences between reported figures. They do not establish corrected market values or independently verified geographic shares.
References
- Paintless Dent Repair Kits Market Research Report 2033
- Paintless Dent Repair Market Report 2034
- Paintless Dent Repair (PDR) Service Report 2025
- Paintless Dent Repair Service Market Forecast to 2031
- Automotive Paintless Dent Removal Tools Market Snapshot
- Mobile Paint Repair Services (Automotive) Market Research Report …
- Automotive Paintless Dent Removal Tools – Global Strategic Business Report
- Paintless Dent Repair Service Market – Global Forecast …
- Paintless dent repair pdr service Worldwide Market Reports
- Mobile Paintless Dent Repair Services Market Size & Forecast 2033
- Paintless Dent Repair PDR Service Market: Major Growth …
- Automotive Paintless Dent Removal Tools Market Size, Share …
- Paintless Dent Repair Network Management Market Research …