PDR Is Growing Faster Than Collision Repair. Here’s What That Means for Your Shop.
Executive takeaway
PDR forecasts indicate faster percentage growth than broader collision repair, but collision repair remains much larger. The evidence supports investigating PDR as a complementary service, not assuming it will replace conventional repairs. Market-size estimates vary sharply, and the supplied research cannot reconcile their definitions or methods. Before expanding, separate forecasts from observed demand and test the opportunity against suitable local jobs, technician capacity, and operating costs.
PDR’s growth advantage needs a careful reading
Does faster industry growth justify expanding your shop’s paintless dent repair capacity? The forecasts support investigating PDR, but they do not establish a shop-level business case. That distinction matters before committing to equipment, training, or technicians.
Paintless dent repair, or PDR, addresses suitable dents without repainting. It is a narrower service category than broader collision repair. The central question is whether its projected growth creates additional, profitable work for your business.
This comparison uses commercial market-report figures summarized in the supplied research, rather than primary claims or shop records. Calculations below are identified separately from reported estimates. Full report methods were unavailable, limiting verification and comparability.
The headline measure is compound annual growth rate, or CAGR. It expresses projected growth as an equivalent annual percentage compounded across a forecast period. It does not predict equal growth every year.
Selected standalone PDR forecasts range from 5.3% to 7.53% annually. Pmarketresearch supplies the lower estimate; the Research and Markets forecast supplies the upper estimate. The supplied research places these projections broadly through the early 2030s, but their forecast windows differ.
Broader collision-repair forecasts range from 1.71% to 2.1% annually. Polaris Market Research supplies the lower figure, while MetaStat Insight supplies the upper figure. These selected reports therefore project slower percentage growth for collision repair.
An editorial calculation, 5.3 ÷ 2.1 ≈ 2.5, illustrates the gap. It compares the lowest selected PDR rate with the highest selected collision-repair rate, reported by MetaStat Insight. PDR’s projected rate is approximately 2.5 times higher in this limited comparison.
That ratio is descriptive, not a controlled comparison of equivalent markets. Different definitions and forecast periods prevent it from isolating an underlying PDR advantage. It also says nothing about which market adds more revenue.
A within-report comparison offers supporting context. Dataintelo’s car-body-repair study projects 5.8% annual growth for PDR and 3.9% for traditional collision repair. Both estimates use its broader repair framework, reducing dependence on comparisons between unrelated reports.
However, Dataintelo’s traditional-repair estimate differs substantially from the standalone collision-market range. It supports the directional finding, but it is not an interchangeable benchmark. Its supplied publication metadata also lists 2023, despite a title describing a 2025–2034 forecast.
Keep three questions separate:
- Growth: How quickly is a defined market projected to expand?
- Size: How much spending does that market represent?
- Opportunity: How much suitable, profitable work can your shop capture?
A faster percentage answers only the first question. The next step is to examine the market’s starting size.
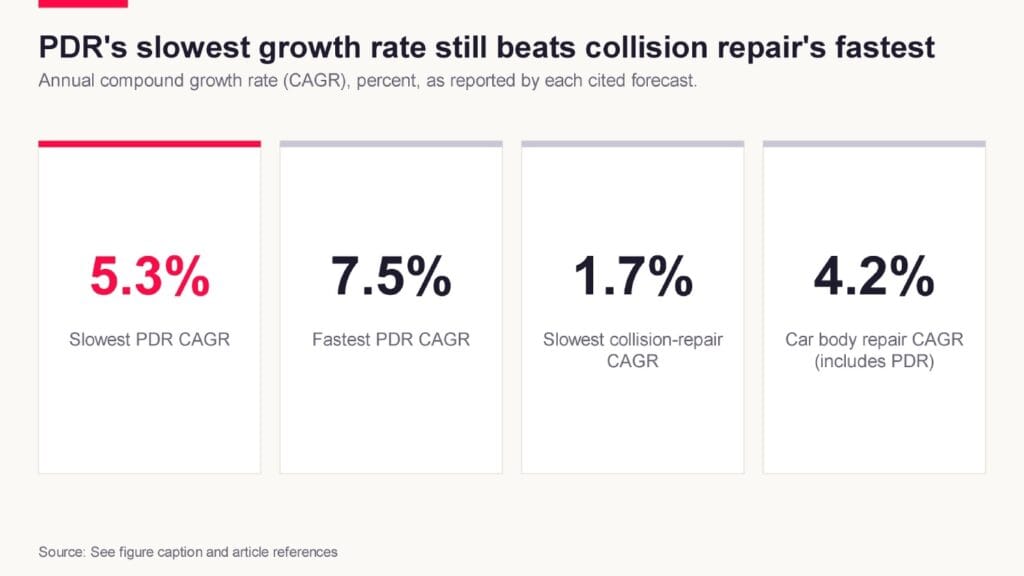
Headline CAGR comparison across reported forecasts for PDR, collision repair, and the broader car-body-repair category. Method: Values taken directly from cited forecasts; no recalculation applied beyond selecting the reported low/high CAGR for each category.
A smaller percentage can still produce more dollars
Faster percentage growth does not necessarily produce more added dollars. A large market can add substantial revenue even at a modest growth rate.
MetaStat Insight estimates global collision repair at $204.3 billion in 2025, reaching $241.4 billion by 2033. Its forecast provides a consistent starting point for examining absolute expansion.
Polaris Market Research puts the 2025 market at $208.1 billion. Together, these estimates place the selected collision-repair range at $204.3 billion–$208.1 billion.
The highest selected standalone PDR estimate is $8.9 billion for 2025, from Deep Market Insights. Dividing the collision estimates by that figure gives roughly 23 times the market value. This calculation illustrates scale, subject to the reports’ unresolved scope differences.
Using MetaStat Insight’s endpoints produces another useful calculation:
- 2025 estimated value: $204.3 billion.
- 2033 forecast value: $241.4 billion.
- Calculated increase: $241.4 billion − $204.3 billion = $37.1 billion.
- Comparison with 2025 PDR: $37.1 billion ÷ $8.9 billion ≈ 4.17.
The projected increase in collision repair’s market value therefore equals approximately 4.17 times the highest selected 2025 PDR estimate. This compares an increase over time with another market’s size in one year. It illustrates scale, not the markets’ relative future dollar growth.
The $37.1 billion is an endpoint difference between 2025 and 2033—not single-year growth. It is also not the sum of additional revenue earned throughout that period. Keeping those distinctions clear prevents a large but valid calculation from becoming a misleading claim.
Percentage growth always acts on a starting base. For illustration, 1% of $204.3 billion is $2.043 billion; 1% of $8.9 billion is $89 million. These are calculations, not forecasts.
The business implication cuts both ways. Do not dismiss PDR because it is smaller, or conventional repair because its projected percentage growth is slower. Neither measure establishes investment returns, and market expansion is not shop profit. The comparison also depends on a more difficult question: what each publisher counts as PDR.
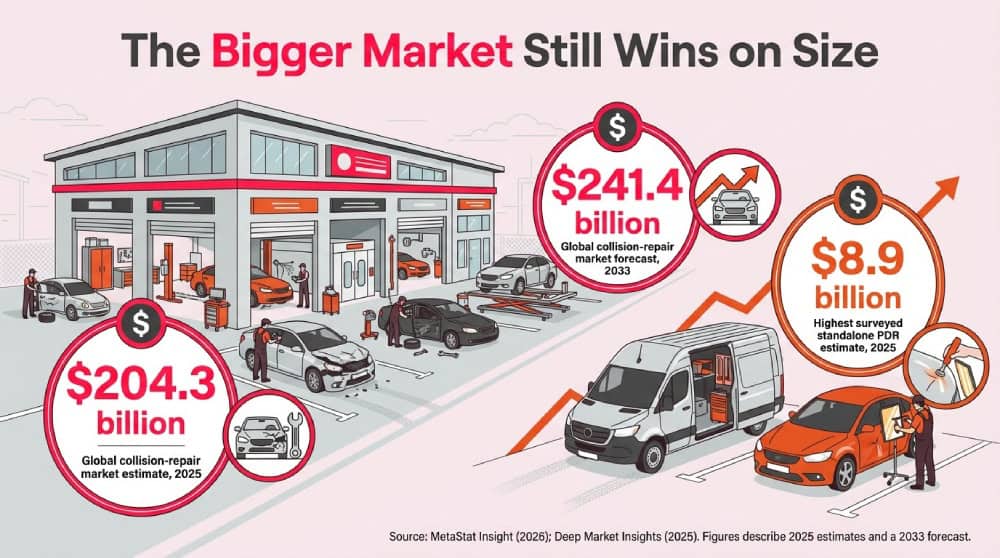
Source: MetaStat Insight (2026); Deep Market Insights (2025). Figures describe 2025 estimates and a 2033 forecast.
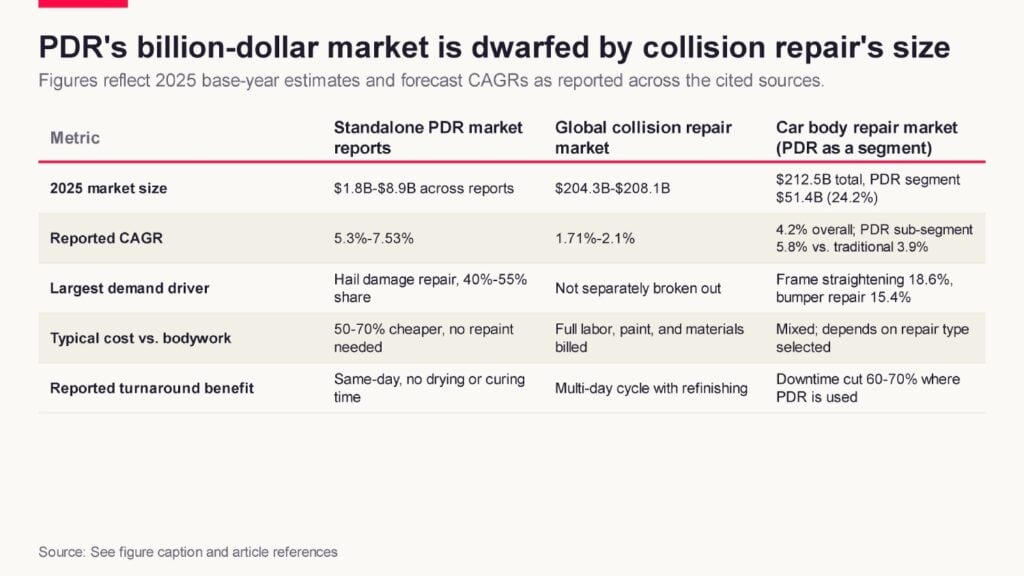
Side-by-side comparison of PDR, collision repair, and car-body-repair markets on size, growth, demand drivers, cost, and turnaround. Method: Cells synthesize reported figures from the cited forecasts; ranges reflect disagreement between independently published reports covering the same categories.
Why nobody agrees on PDR’s market size
PDR market-size estimates disagree too sharply to support one settled valuation. Five selected reports place the 2025 market between $1.8 billion and $8.9 billion:
- $1.8 billion: Marketintelo.
- $3.33 billion: Growth Market Reports.
- $3.85 billion: Pmarketresearch.
- $7.0 billion: Dataintelo.
- $8.9 billion: Deep Market Insights.
Editorial calculation: $8.9 billion ÷ $1.8 billion ≈ 4.9. The highest estimate is roughly 4.9 times the lowest. This spread is not a statistical uncertainty interval, nor does it establish that the actual total falls between those endpoints.
The disagreement grows when PDR appears within a broader repair category. Dataintelo’s car-body-repair report assigns PDR a 24.2% share, worth $51.4 billion in 2025. That exceeds every standalone estimate listed above.
The contrast exists even within that publisher’s reports. Editorial calculation: $51.4 billion ÷ $7.0 billion ≈ 7.3. A shared publisher therefore does not make a parent-category segment and a standalone estimate interchangeable.
Scope differences could explain some disagreement, but the supplied evidence does not verify that explanation. Similar titles do not establish that researchers counted identical services, businesses, or revenue. Four questions deserve attention:
- Service boundaries: Does the estimate cover dent-removal labor alone or bundled repair services?
- Delivery channels: Does it include specialists, mobile operators, dealerships, body shops, or some combination?
- Parent categories: Does it measure a distinct service market or allocate broader repair revenue to PDR?
- Revenue treatment: For subcontracted work, does it count the technician’s payment, the customer’s bill, or both?
These choices can change measured revenue without changing the number of repaired vehicles. Counting both subcontractor payments and full shop invoices, for example, could create overlapping revenue. That is a hypothetical accounting risk, not a finding about these reports.
One proposed explanation is that standalone estimates count independent operators while broader estimates include all body-shop PDR work. The supplied evidence does not verify that distinction. It remains a hypothesis until publishers’ definitions and calculations establish it.
The larger figure should not be rejected merely because it differs. A broader definition could legitimately answer a different question. Equally, a plausible scope explanation cannot validate an estimate without methodological evidence.
Averaging the figures would not resolve their incompatibility. An average has economic meaning only if its inputs measure comparable activity. Similar estimates would also provide stronger reassurance only if their methods were transparent and sufficiently independent.
For planning, choose a definition that matches the services your shop could sell. Until the reports’ boundaries are reconciled, their valuations provide competing estimates—not a reliable single market total.
Hail is central, but the percentages tell different stories
Hail is a major reported source of PDR demand, but the percentages measure different things. Revenue shares, claims adoption, and customer categories cannot substitute for one another.
Three reports assign different shares of global PDR revenue or value to hail-damage repair:
- 36%: Deep Market Insights.
- 40%: Dataintelo.
- 55%: Pmarketresearch.
Across all three, the reported range is 36%–55%, rather than the narrower 40%–55% summary appearing in the supplied research. Hail represents roughly one-third of revenue in one estimate and a majority in another.
These figures support hail’s importance, but they do not establish a reliable common share. The supplied material does not provide enough information about measurement periods, methods, or segment definitions to reconcile them.
The adoption statistic asks a different question. Dataintelo reports approximately 80% of US insurance claims identified as hail damage already use PDR. That does not contradict its 40% estimate for hail’s share of global PDR value: the geography, units, and reference populations differ.
The revenue measure asks, “How much PDR business comes from hail?” The claims measure asks, “How many insured hail claims use PDR?” A claim count does not establish each claim’s repair value or whether PDR handles the entire repair.
If the 80% figure is accurate, adoption alone offers limited remaining growth within that measured population. A business case based entirely on converting conventional hail repairs would therefore need stronger justification. The remaining claims should not automatically count as convertible work; their repair suitability is unknown.
Other possible growth routes include more hail-related jobs, higher revenue per repair, or additional non-hail demand. These are potential mechanisms, not outcomes demonstrated by the adoption statistic.
Customer segmentation introduces another denominator—the total against which a percentage is calculated. Pmarketresearch reports individual vehicle owners at 45%, its largest customer segment. That share measures neither hail demand nor insurance adoption.
Classification matters when an owner’s repair involves an insurer. Does the report classify work by vehicle owner, payer, or referring organization? Without that clarification, owner and insurance channels should not become separate, additive opportunities.
For your own records, distinguish damage source, referral channel, payer, and repair value. Those categories help identify when apparently different channels describe the same jobs.
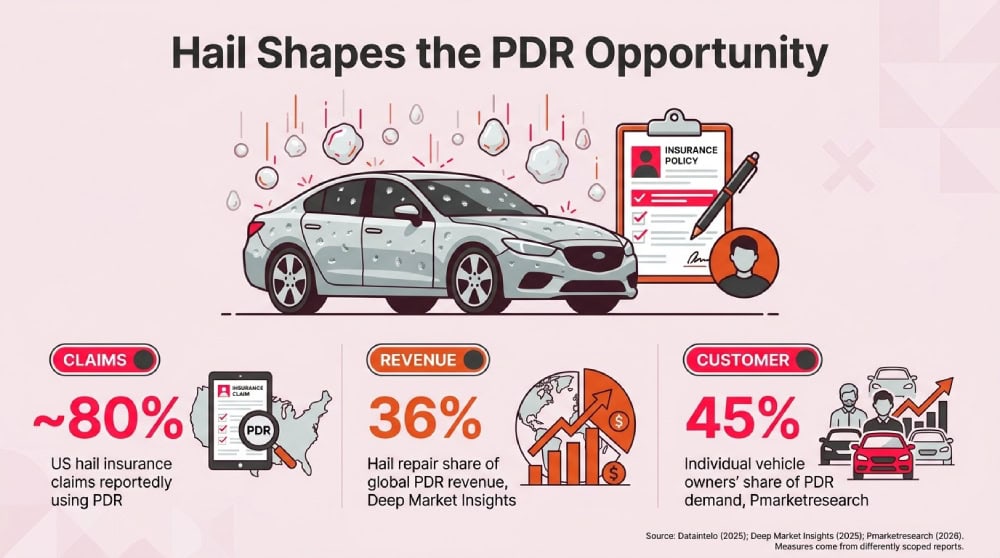
Source: Dataintelo (2025); Deep Market Insights (2025); Pmarketresearch (2026). Measures come from differently scoped reports.
North America leads, but your service area still matters
North America has the largest regional share in the selected estimates, but regional prominence does not establish local opportunity. Continental totals cannot reveal demand accessible within your service area.
Pmarketresearch’s 2025 breakdown allocates its $3.85 billion global estimate as follows:
- North America: $1.54 billion.
- Europe: $962.5 million.
- Asia Pacific: $847.0 million.
- Latin America: $269.5 million.
- Middle East and Africa: $231.0 million.
These figures sum to the reported global total. North America represents 40%, calculated from the regional and global values. That establishes arithmetic consistency, not independent accuracy.
Dataintelo assigns North America a 42% share of its $7.0 billion global estimate. Applying that percentage implies approximately $2.94 billion in regional revenue. This is an editorial calculation, not a separately reported regional value.
The shares differ by only two percentage points, yet the implied revenues differ by approximately $1.40 billion. Similar proportions therefore do not validate the underlying dollar estimates. The agreement concerns relative regional weight, not a confirmed market value.
Translate that broad context into local questions. These are recommended checks, not findings from the reports:
- Define your service area. Use current customer locations and realistic travel limits. For mobile work, account for the time required between jobs.
- Identify customers behind inquiries. Separate owners, fleets, dealers, and repair businesses. Distinguish repeat relationships from isolated requests.
- Verify referral sources. Review actual referrals and prospective partners’ requirements. A nearby insurer or dealership is not evidence of available work.
- Track conversion and suitability. Record which inquiries become bookings, which jobs qualify for PDR, and why others do not proceed.
- Test demand across periods. Keep unusually busy periods separate from recurring workload before planning permanent capacity.
The relevant market is the work your shop can reach, perform, and win. A continental share cannot answer those questions.
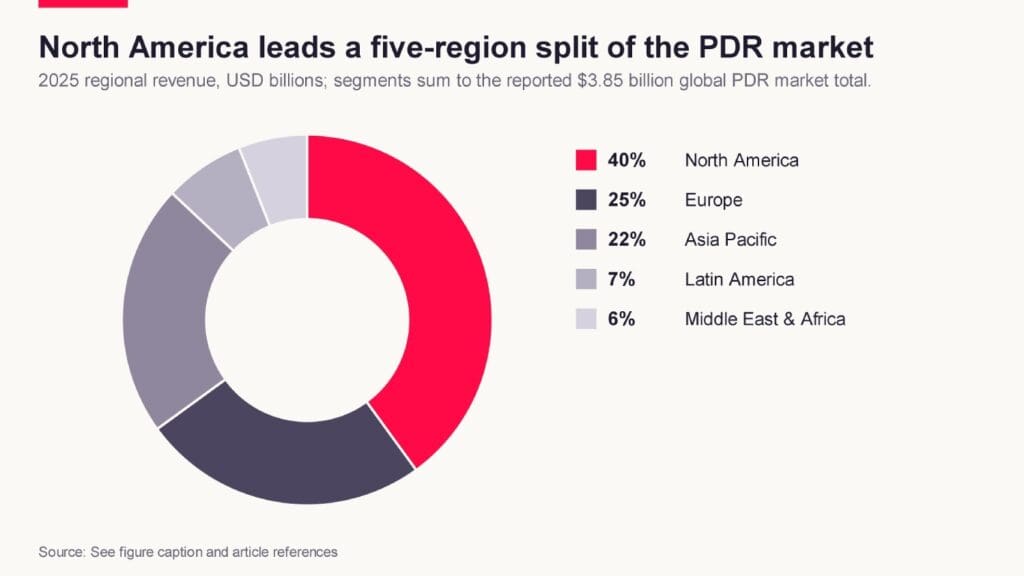
Regional distribution of the $3.85 billion global PDR service market, 2025. Method: Regional dollar values taken directly from the cited source; segments are mutually exclusive and sum to the reported global total.
The mobile repair boom is bigger than PDR alone
The forecasts do not establish paintlessness as the cause of faster growth. Mobile paint-repair services also show strong projected expansion, despite including scratch repairs and paint touch-ups alongside PDR.
Dataintelo projects 8.1% annual compound growth for that broader mobile category. This exceeds the selected standalone PDR range, although differing scopes and forecast periods limit direct comparison.
Its service-level projections also extend beyond paintless work:
- Dent repair: 8.4%.
- Scratch repair: 7.9%.
- Paint touch-up: 8.0%.
- Bumper repair: 7.6%.
Dent repair leads, but paint touch-up trails by just 0.4 percentage points, an editorial calculation. These forecasts suggest a broader projected opportunity; they do not identify the characteristics causing growth.
Mobile describes delivery; paintless describes a repair method. The categories overlap without being interchangeable. A mobile-services forecast therefore cannot substitute for a standalone PDR forecast.
The reported adoption figures illustrate this overlap, provided their denominators remain separate:
- About 80% of US insurance claims identified as hail damage use PDR, according to Dataintelo’s PDR report.
- Approximately 68% of dent incidents handled by mobile providers fall into the paintless category, according to its mobile-services report.
Neither percentage measures PDR’s share of all collision repair. Their difference is not an adoption gap because they describe different populations. The mobile figure instead suggests substantial existing paintless use within mobile dent repair.
Valuations present a separate comparability problem. Marketintelo estimates the 2025 mobile paint-repair market at $7.2 billion.
Dataintelo puts its similarly named market at $18.5 billion for 2025. Dividing those values gives roughly 2.6 times the smaller estimate. The supplied evidence does not reconcile the difference; similar labels and matching growth rates do not establish identical coverage.
Convenience, mobility, and lower labor intensity are possible explanations for growth across these services. However, the forecasts do not isolate those factors or establish their causal importance. They also do not show that mobile delivery produces better margins than shop-based work.
For planning, evaluate the service bundle without adding overlapping market totals. Standalone PDR estimates may include work already counted within mobile services. Adding dent repair to a mobile total that includes it would likewise double-count activity.
Test whether customers value mobile delivery, whether suitable jobs justify travel, and whether scheduling preserves margins. The opportunity lies in profitable work—not the sum of overlapping forecasts.
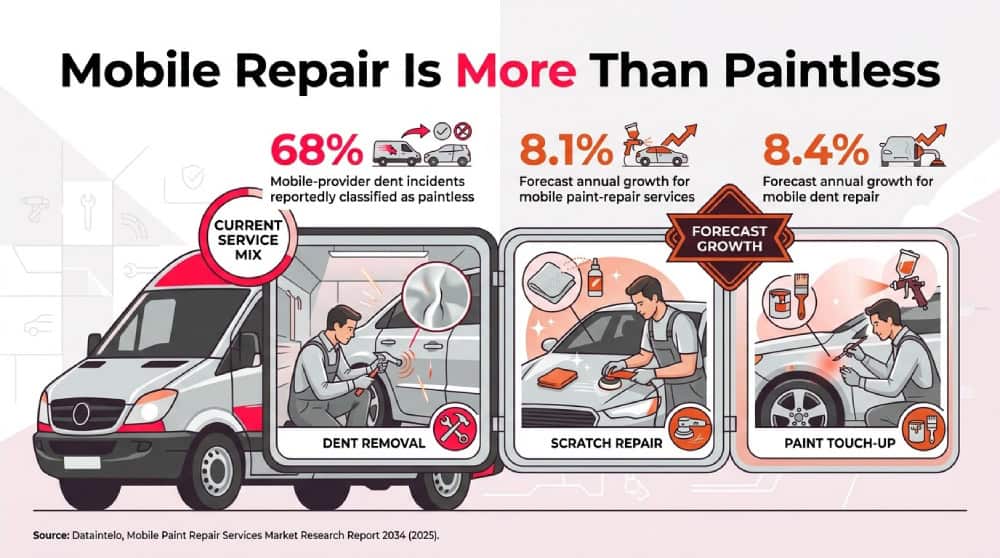
Source: Dataintelo, Mobile Paint Repair Services Market Research Report 2034 (2025).
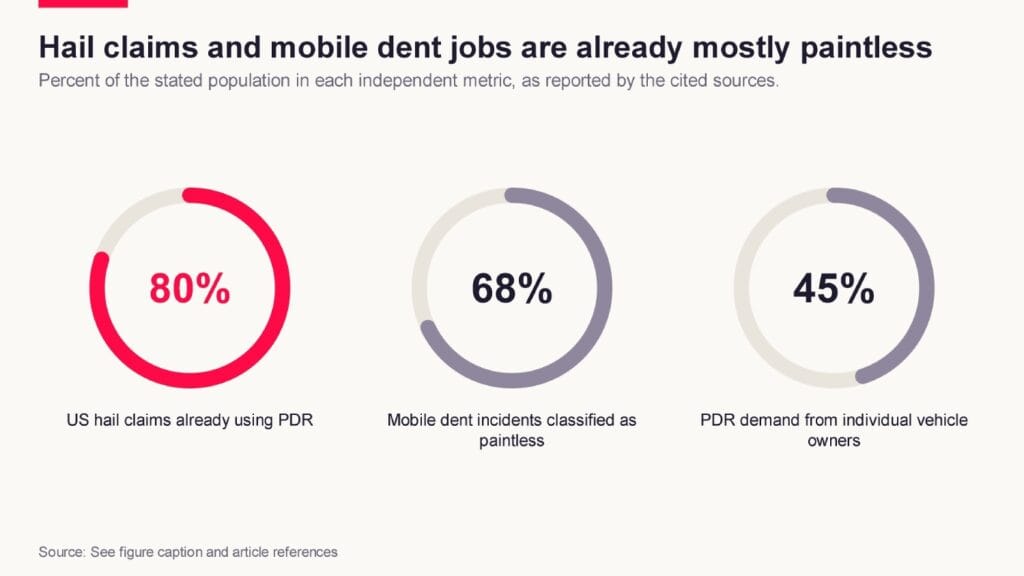
Three independent penetration metrics showing how embedded PDR already is within hail claims, mobile dent repair, and individual-owner demand. Method: Each percentage is an independent metric from its cited source; the three figures are not mutually exclusive shares of one whole and are shown as separate progress rings.
Turn the forecasts into a shop-level business case
Evaluate PDR as a complementary service, not a presumed replacement for full collision repair. Body shops should assess whether suitable dent work strengthens their service mix. Specialists should assess whether additional capacity serves demand without weakening quality or turnaround.
Dataintelo’s car-body-repair report attributes part of PDR’s forecast advantage to a reported 60–70% reduction in vehicle downtime. The supplied material does not establish the measurement method, comparison baseline, or repair conditions. Treat this as a claim to test locally, not a promised result.
Shorter downtime could reduce rental exposure where customers need replacement vehicles. It does not establish a particular insurer saving or shop margin. Those outcomes depend on actual repair costs, rental duration, pricing, and who bears each expense.
The following measures are decision tools, not reported market findings. Use internal records to compare potential operating models:
- Eligible jobs: Identify repairs assessed as suitable for PDR. Separate additional work from jobs already served through existing arrangements.
- Turnaround: Track arrival-to-completion time alongside hands-on repair time. Distinguish technical speed from scheduling delays.
- Technician capacity: Record skilled hours, utilization, and scheduling constraints. Determine whether demand fits current operations or requires staffing changes.
- Rework: Track callbacks, corrective work, and associated costs. Faster initial completion has less value if corrections consume the savings.
- Referral reliability: Measure referral volume, acceptance, completion, and partner availability. Check whether relationships remain dependable during busy periods.
- Contribution per job: Subtract clearly defined job-related costs from revenue, including subcontracting, travel, and rework where applicable. Then assess whether the remaining contribution covers additional fixed commitments.
Compare in-house capacity, partnerships, and mobile delivery using the same measures. In-house expansion requires sufficient utilization and staffing. Partnerships require dependable availability and service quality. Mobile delivery requires explicit allowances for travel, scheduling, and operating costs.
A bounded trial can test these assumptions before substantial fixed commitments. Set cost, quality, and turnaround targets, then compare results with your current arrangement. Measured job economics should determine investment scale.
Five checks before repeating a PDR growth claim
Before repeating a growth claim, establish what the number measures and how it was produced. These five checks follow the accompanying decision guide’s topics while separating reported evidence from interpretation.
1. Identify the measure.
Market size estimates a dollar value; CAGR expresses projected change across a stated period. Claims adoption and service-mix percentages describe different populations. Record the denominator before comparing percentages, and never substitute adoption for revenue growth.
2. Record geography and dates.
Keep the base year, forecast horizon, publication date, and geography beside each statistic. A global forecast cannot establish local demand, and different forecast periods can produce different growth rates.
Flag inconsistent metadata rather than silently resolving it. For example, the supplied record dates Dataintelo’s car-body-repair report to 2023 while its title describes 2025–2034. That discrepancy leaves the version and publication timing uncertain; it does not establish that the reported figures are wrong.
3. Inspect category boundaries and overlap.
Determine whether the estimate covers services, tools, kits, mobile operations, or PDR within broader repair revenue. Adding overlapping categories can count the same activity twice.
Dataintelo’s car-body-repair report, for example, treats PDR as a segment of a larger market. That differs conceptually from a dedicated estimate, but labels alone cannot reveal every inclusion rule. “Standalone” does not guarantee comparability.
4. Compare methods before treating agreement as confirmation.
The selected 2025 PDR estimates span roughly 4.9 times, from $1.8 billion to $8.9 billion. This calculated spread warrants scrutiny, but it is not an error band or evidence that either endpoint is correct.
Compare data inputs, sampling, estimation procedures, and revenue definitions where available. The supplied evidence does not establish methodological independence or reconcile the valuations. Missing methods are a limitation, not proof of reliability or error.
5. Separate estimates, calculations, and recommendations.
A publisher’s CAGR is a reported forecast. A ratio between two CAGRs is an editorial calculation. Hiring technicians is a business decision requiring additional evidence.
Pmarketresearch’s PDR forecast describes projected growth, not an observed future result. Use “projects” or “forecasts,” rather than claiming the market already “is growing” at that rate.
A useful attribution template is: “In its [publication date] report, [publisher] projects [defined market] in [geography] to grow at [CAGR] from [base year] to [forecast year]. This is a forecast; [scope or methodological limitation] limits comparison.” Fill only verified fields and identify unavailable details.
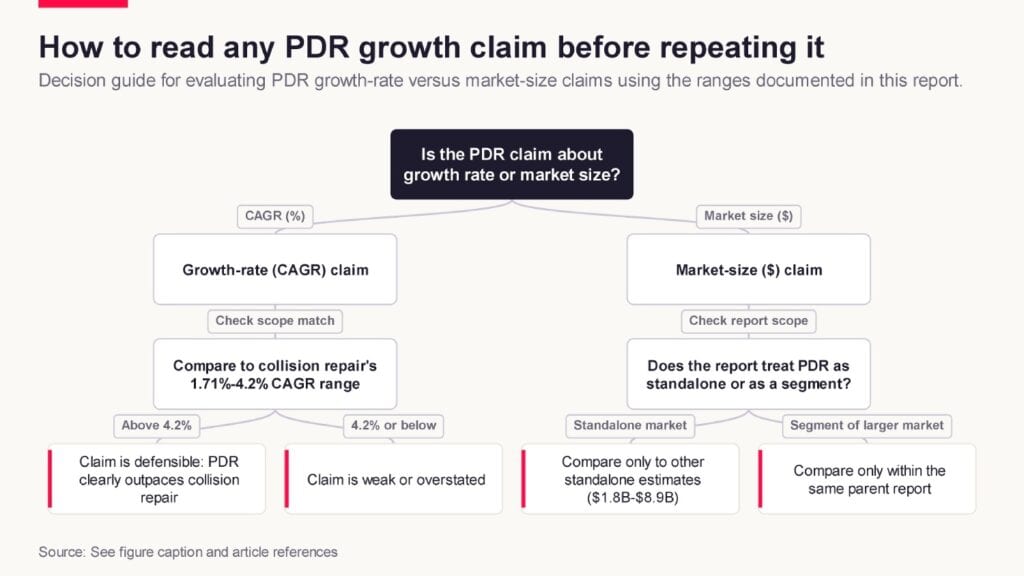
A practical guide for checking whether a PDR growth-rate or market-size claim is being compared on an apples-to-apples basis. Method: Tree logic synthesized from the comparative CAGR and market-size findings in this report; thresholds reflect the reported ranges for collision repair and car-body-repair CAGRs.
Expand on evidence, not on the biggest headline
PDR’s forecast growth advantage supports investigation, not automatic expansion. The evidence does not establish that PDR will displace conventional repair, or that adding capacity will improve your shop’s returns.
The larger collision-repair market also continues expanding in the selected forecasts. PDR can therefore be evaluated as a potential addition to an existing service mix, rather than a reason to abandon it.
Turn that conclusion into a staged decision:
- Define the opportunity. Specify customers, damage types, and delivery model before selecting equipment or staffing. A body shop retaining outsourced jobs faces a different decision from a specialist expanding its service area. Insurer-facing operators should assess repair suitability, turnaround, and total claim economics—not assume savings from adoption alone.
- Establish a documented baseline. Review completed repairs, declined inquiries, outsourced jobs, and unconverted estimates. Separate confirmed PDR-suitable work from uncertain inquiries. Distinguish technician shortages from weak demand, unsuitable damage, and temporary hail-related surges.
- Test the economics before committing. Compare plausible demand scenarios with technician costs, equipment, training, travel, administration, and disruption to existing work. Include both volume-related costs and commitments that remain when demand falls. Where uncertainty is high, test a partnership or limited trial first.
Set conditions for continuing, modifying, or stopping a trial before it begins. Those conditions should reflect your costs, capacity, quality requirements, and service obligations—not an industry-wide growth rate.
The reports cannot establish your local demand, achievable margins, staffing needs, or investment returns. Their valuation disagreements reinforce the need for operating evidence rather than a larger headline number.
Expand where suitable demand and documented economics support it; preserve flexibility where they do not. Market forecasts can frame the question. Your shop’s results should determine the commitment.
Limitations
- The supplied evidence summarizes commercial market reports. Full source text, underlying datasets, and estimation methods were unavailable for independent verification.
- Market definitions and forecast periods differ. Publication dates are sometimes missing or inconsistent with report titles, including a 2023 date attached to a 2025–2034 forecast.
- Similar reports may share underlying research. Agreement across publishers does not establish independent confirmation, and valuation spreads are not statistical uncertainty intervals.
- No primary claims records or audited shop revenue were supplied to resolve competing estimates. Global forecasts and reported US adoption rates cannot establish local profitability, repair suitability, or achievable growth.
References
- Paintless Dent Repair PDR Service Market
- Global Automotive Collision Repair Market
- Paintless Dent Repair Market Size, Share & Forecast …
- Top Companies Analysis
- Automotive Collision Repair Market Size, Growth Report, 2026-2034
- Paintless Dent Repair Service Market – Global Forecast …
- Paintless Dent Repair Market Report 2034
- Paintless Dent Repair Market Research Report 2034
- Car Body Repair Market Size, Share & Forecast Report 2025 to 2034 | Dataintelo
- Mobile Paint Repair Services Market Research Report 2034
- Paintless Dent Repair Service Market Forecast to 2031