
Why PDR Market Forecasts Differ by Billions—and Which Numbers Your Business Can Use
Executive takeaway
PDR forecasts count different combinations of repair services, tools, kits, and broader bodywork. Start with the revenue your business actually earns, then check the estimate’s year, boundaries, and growth arithmetic. Scope differences explain some disagreement, but the supplied evidence cannot reconcile service estimates ranging from $1.4 billion to $8.9 billion in 2025. Avoid adding overlapping equipment categories or treating mixed repair invoices entirely as PDR revenue. Use global forecasts as context; base operating commitments on local demand, capacity, and costs.
Same repair, very different market numbers
$1.8 billion, $2.55 billion, $7.0 billion, and $8.9 billion: four estimates describe the global PDR market in 2025. Paintless dent repair, or PDR, removes dents without repainting. These headlines, however, do not necessarily measure the same revenue.
That distinction matters when hiring technicians, buying equipment, or funding expansion. A larger market estimate can make an investment appear attractive without demonstrating greater demand for that business.
The four-baseline comparison illustrates the problem. The supplied research describes each estimate as follows:
- $1.8 billion — services: Marketintelo measures dent-removal services that preserve the vehicle’s paint.
- $2.55 billion — services: Wiseguy Reports treats PDR as a service segment within automotive repair.
- $7.0 billion — services and equipment: Dataintelo includes technician labor, rods, lights, glue-pulling systems, and DIY kits.
- $8.9 billion — services: Deep Market Insights reports a service-market valuation, with coverage described as including insurance-linked networks and fleet operations.
Scope helps explain the disagreement, but does not reconcile it. Repair payments and equipment sales represent different transactions. Combining them describes a broader commercial market, not simply more customer work available to technicians.
Yet the largest figure carries a services label, while the smaller $7.0 billion estimate includes equipment. Scope alone therefore cannot establish why the estimates differ or which is accurate.
The four headline baselines also omit a lower service estimate. Worldwide Market Reports places the 2025 PDR service market at $1.4 billion.
Service-labelled estimates consequently span $1.4 billion to $8.9 billion. This spread reflects disagreement between publishers, not a statistical confidence interval. The supplied evidence cannot quantify how much each coverage or methodological choice contributes.
The central business question is therefore which number measures what you sell? Service operators need evidence about repair revenue; equipment suppliers need evidence about product sales. Neither should treat a global headline as its directly accessible opportunity.
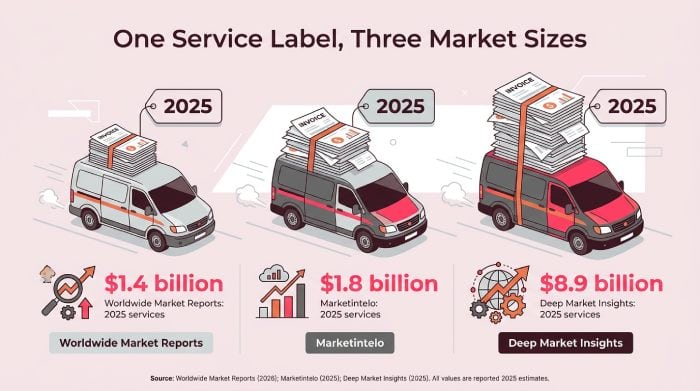
Source: Worldwide Market Reports (2026); Marketintelo (2025); Deep Market Insights (2025). All values are reported 2025 estimates.
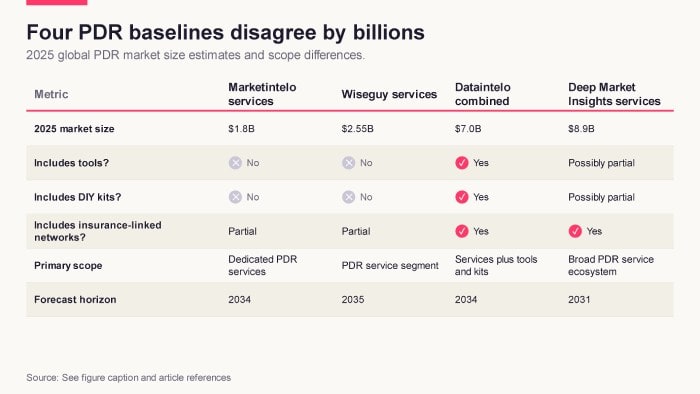
Key 2025 estimates for the global PDR market vary from $1.8 billion to $8.9 billion because reports alternately measure services only, services plus tools and kits, or broader insurance-linked and hybrid body shop work. Method: Values are taken directly from Marketintelo’s services report, Wiseguy’s PDR service forecast, Dataintelo’s combined services-plus-tools market, and Deep Market Insights’ broad service market; scope notes are used to classify whether tools and kits are included.[1][13][15][17]
Follow the money before comparing forecasts
PDR describes a repair method, not a single revenue category. Technicians reshape panels from behind the damage or pull them from the surface without repainting. The supplied service research describes this method as preserving an intact paint surface.
That technical definition does not determine what a forecast counts. Three economic layers help distinguish the transactions:
- Customer payments for services. Customers purchase completed dent repairs. Marketintelo’s services report covers independent technicians, mobile units, and specialized repair shops using PDR as their primary method.
- Equipment and kit sales. Buyers purchase the means to perform repairs. PMarketResearch’s tools scope includes pullers, tool kits, glue pullers and tabs, lighting systems, and other equipment.
- Wider repair spending. Analysts classify PDR within a larger repair economy. Dataintelo’s car body repair report places it alongside collision repair, frame straightening, bumper repair, and scratch or touch-up services.
A repair method does not always correspond to a separately billed service. Illustratively, a mixed invoice could include dent removal and other bodywork. Using PDR on that job would not make every invoice dollar PDR service revenue.
Equipment purchases involve another distinction: the seller earns revenue while the workshop incurs expenditure. A bundled kit packages equipment together; it does not necessarily constitute a market outside tools.
According to the supplied synthesis, Dataintelo’s combined PDR report counts technician labor alongside tools and DIY kits at first sale. Its $7.0 billion estimate for 2025 should therefore not be read as professional-service spending alone.
These categories cannot automatically be added. A tools estimate may already include kits, creating double counting if a separate kits forecast is added. Adding services to a combined services-and-equipment estimate would likewise repeat revenue already included.
Even without overlap, summing equipment sales and repair payments answers a different question from measuring final customer demand. Both transactions can generate genuine revenue, but at different points in the repair chain.
Before comparing forecasts, identify who pays, who receives the money, and what changes hands. These boundaries separate a technician’s sales opportunity from a supplier’s market and from wider repair spending.
Services-only estimates still need a closer look
A services label does not produce a consistent market estimate. Four publishers place global PDR services between $1.4 billion and $8.9 billion in 2025. Their stated coverage deserves examination rather than compression into an assumed consensus:
- Worldwide Market Reports: $1.4 billion. Its service forecast projects $2.8 billion by 2032 and identifies mobile services as the largest segment.
- Marketintelo: $1.8 billion. Its services report describes independent technicians, mobile units, and specialized shops using PDR as their primary method.
- Wiseguy: $2.55 billion. Its service outlook includes hail damage repair, minor dents and dings, and mobile PDR.
- Deep Market Insights: $8.9 billion. Its service forecast projects $9.56 billion in 2026 and $13.66 billion by 2031.
The highest estimate exceeds the lowest by $7.5 billion and is roughly 6.4 times as large. These are calculations from the reported endpoints. The discrepancy is too large to dismiss as rounding, but the figures alone cannot explain it.
Two other estimates require explicit year qualifications. As an earlier-year comparison, Intent Market Research reports $4.3 billion for 2024. Its scope includes shop-based and mobile services across passenger cars, commercial vehicles, and two-wheelers.
Research and Markets gives $2.17 billion for 2026, followed by $3.37 billion in 2032. Neither this figure nor Intent’s 2024 estimate belongs in an unqualified 2025 comparison. Back-calculating a missing year would produce an estimate, not a directly reported observation.
Coverage differences remain plausible explanations, not established reconciliations. The available descriptions identify some services and providers, but do not establish matching revenue boundaries. Four methodological questions would help clarify the disagreement:
- Insurance networks: Does the estimate count repair revenue, network administration fees, or both? How does it prevent counting the same repair through multiple organizations?
- Fleet contracts: Are fleet repairs included alongside individual customer jobs? How are PDR payments separated from bundled services?
- Hybrid jobs: Does a mixed repair contribute only its PDR component or the entire invoice?
- Geography: Which countries have directly observed data, and which depend on extrapolation?
These are checks to perform, not verified descriptions of particular publishers. Pricing assumptions and estimated repair volumes could also explain differences, but their contributions remain unknown.
A smaller estimate might isolate the intended service more carefully—or omit legitimate activity. A larger estimate might capture overlooked providers—or include revenue outside the intended market. Size alone establishes neither accuracy nor relevance.
For a dedicated operator, Marketintelo’s stated provider coverage offers a relevant starting point for investigation. It does not validate the total. Keep estimates separate until their methods justify comparison, rather than averaging them into false precision.
Your tool bill belongs to a different market
Your equipment purchase is supplier revenue, not workshop repair revenue. Tools forecasts therefore measure a different transaction from customers paying technicians to remove dents.
Three publishers report markedly different global tools estimates for 2025:
- PMarketResearch: $1.2 billion. Its tools report includes pullers, tool kits, glue pullers and tabs, lighting systems, and other equipment.
- Wiseguy Reports: $2.1278 billion. Its tools estimate falls between the other figures, but that position does not establish greater accuracy.
- MarketResearchFuture: $3.49 billion. Its product categories include slide hammers, induction dent pullers, dent rods, specialty PDR tools, and other devices.
The highest estimate is approximately 2.9 times the lowest, calculated from those figures. A shared year and similar titles do not resolve this disagreement. Averaging the estimates would conceal it.
Product classifications provide clues, but not a complete explanation. Emergen Research separately identifies dent rods, hammers, pullers, glue tabs, LED lighting, and accessories. Thus, tools can include supporting equipment, not just instruments that move metal.
Different category names need not imply different coverage. One publisher might list lighting separately while another includes it under other equipment. The supplied descriptions do not quantify how classification choices affect valuations.
Kits create a clearer overlap risk. PMarketResearch explicitly includes tool kits, so adding a standalone kits forecast could count overlapping sales twice. A separate report title does not establish an additive market. Compatible product definitions would be needed to quantify any overlap.
The raw synthesis also proposes installed equipment versus new sales as an explanation. Installed equipment means tools already owned; annual sales measure purchases during a particular year. The available evidence does not verify that publishers use these different bases, so this remains a hypothesis.
Equipment spending and repair demand need not move together. A purchase might equip a new technician, replace worn tools, or expand repair capabilities. Conversely, a technician might complete more jobs using equipment already owned. These are economic possibilities, not measured findings from the forecasts.
Use equipment research to frame supplier and investment questions, not to estimate customer repair revenue. For a workshop purchase, test whether improved capacity, quality, or efficiency justifies the cost. A larger global tools headline cannot answer that question.
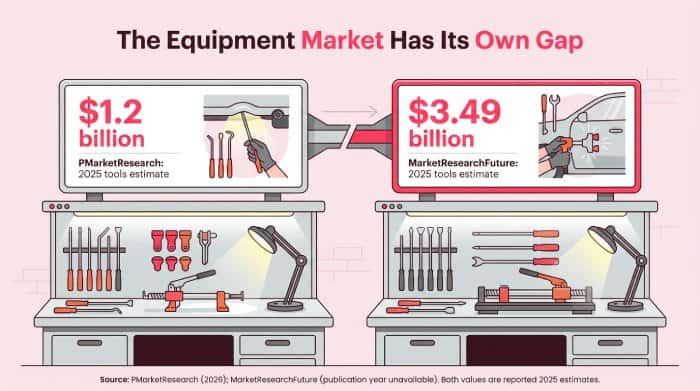
Source: PMarketResearch (2026); MarketResearchFuture (publication year unavailable). Both values are reported 2025 estimates.
The $51.4 billion figure needs a warning label
The $51.4 billion figure is a calculation, not an independent estimate of standalone PDR revenue. Its arithmetic is straightforward; its accounting meaning remains uncertain.
Dataintelo’s car body repair report gives a $212.5 billion global market in 2025 and a 24.2% PDR share. Applying that share produces:
- Calculation: $212.5 billion × 24.2% = $51.425 billion.
- Rounded result: approximately $51.4 billion.
- Interpretation limit: the calculation does not establish which transactions the segment includes.
Multiplication translates the reported share into dollars. It does not verify how the publisher classifies repair spending or whether the share represents consistently allocated revenue.
The raw synthesis interprets this result as invoice activity involving PDR, including work using it as a supporting method. That interpretation is not verified by underlying accounting rules in the supplied material. It should not be presented as a demonstrated explanation for the gap against smaller forecasts.
Several accounting approaches are possible. A publisher might count PDR line items, allocate part of mixed bills, or classify entire invoices by their principal service. Each approach would give the resulting total a different meaning. The evidence does not establish which Dataintelo uses.
A second calculation illustrates a related boundary problem. Marketintelo’s mobile paint repair report estimates $7.2 billion globally in 2025, with dent repair representing 28.8%. Multiplication implies approximately $2.07 billion in mobile dent repair, rather than an independently reported market estimate.
Mobile dent repair identifies a service category and delivery setting, not necessarily a paintless method. The supplied synthesis describes operators offering dent work alongside paint touch-ups and other cosmetic services. It does not establish the PDR-only proportion of that dent repair segment.
The two calculations therefore answer different questions. One places PDR inside body repair; the other places dent repair inside mobile cosmetic services. Neither label alone demonstrates equivalence with standalone PDR revenue.
Nor do these surrounding markets establish an opportunity wholly available to specialists. Some work may require other methods, and technical suitability would not establish an individual operator’s ability to win it.
For business use, label the larger result precisely: approximately $51.4 billion implied by Dataintelo’s reported 2025 body repair total and PDR share; accounting scope unverified. Keep the mobile dent repair calculation separate. Both provide context, not a verified pool of accessible specialist revenue.
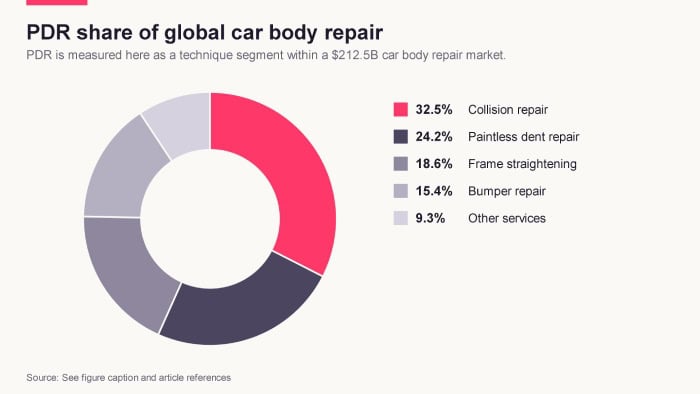
Paintless dent repair accounts for about one quarter of global car body repair demand in 2025, highlighting its importance as a technique even though dedicated PDR services form a much smaller industry segment. Method: Segment shares (collision repair 32.5%, PDR 24.2%, frame straightening 18.6%, bumper repair 15.4%, others 9.3) are taken from Dataintelo’s car body repair report, which also provides the $212.5B total market size for 2025.[3]\
Kits may grow faster—but faster than which services?
Kits grow faster than some service forecasts—not all of them. Their reported 8.4% growth exceeds a 7.4% service projection but falls below another services forecast of 10.7%. Different periods further limit the comparison.
The Business Research Company’s kits series estimates $1.21 billion in 2025 and $1.31 billion in 2026. It projects $1.81 billion by 2030, reporting 8.1% growth initially and an 8.4% forecast compound annual growth rate thereafter.
Compound annual growth rate, or CAGR, is the constant annual rate connecting starting and ending values. Growth compounds on the previous year’s total. The rate summarizes a trajectory; it does not predict identical growth each year.
Figure discussion: kits versus service-market growth
| Series | Starting estimate | Later estimate | Reported annual growth |
|---|---|---|---|
| Kits, 2025–2026 | $1.21 billion | $1.31 billion | 8.1% |
| Kits, 2026–2030 | $1.31 billion | $1.81 billion | 8.4% |
| Services, Deep Market Insights, 2026–2031 | $9.56 billion | $13.66 billion | 7.4% |
| Services, Worldwide Market Reports, 2025–2032 | $1.4 billion | $2.8 billion | 10.7% |
The rounded kits endpoints broadly support the stated trajectory. Growth from $1.31 billion to $1.81 billion over four years implies approximately 8.4% annually. The 2025–2026 figures imply about 8.3%, rather than 8.1%; rounding could explain that difference.
Against Deep Market Insights’ service forecast, kits lead by one percentage point in reported annual growth. The forecast windows differ, however, so this is not a matched-period comparison.
Worldwide Market Reports’ service forecast reverses the ranking: 10.7% exceeds kits by 2.3 percentage points. Its rounded endpoints imply approximately 10.4% over seven years. Reported rates and recalculated values should remain distinguishable; neither proves which segment will actually grow faster.
Source repetition also requires caution. The Research and Markets kits listing gives matching figures, but the supplied evidence does not conclusively establish its relationship to the original study. It should not be counted as independent confirmation without checking authorship and provenance.
The National Law Review press release is identified in the supplied synthesis as summarizing The Business Research Company’s research. That appearance increases visibility, not the number of independent studies.
Faster kit-sales growth establishes neither faster technician revenue nor DIY substitution. Kits serve professionals and consumers. Aggregate revenue does not reveal which buyers drive growth or whether DIY purchases replace paid repairs.
Suppliers should test who buys, whether growth reflects units or prices, and which buyers generate sustainable margins. Service operators need local customer and booking evidence to assess DIY competition. A global kits CAGR cannot supply those answers.
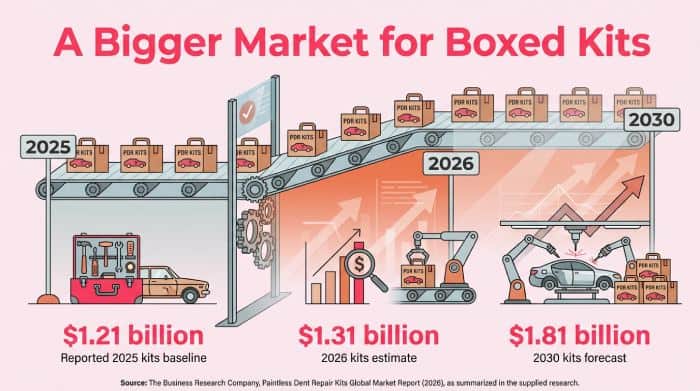
Source: The Business Research Company, Paintless Dent Repair Kits Global Market Report (2026), as summarized in the supplied research.
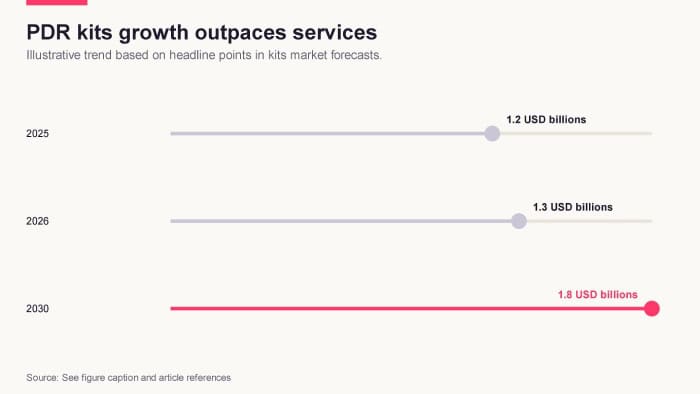
Forecasts for paintless dent repair kits show faster percentage growth than most service and tools markets, reflecting strong DIY adoption and e-commerce-driven distribution. Method: The line uses key points from The Business Research Company’s kits report—$1.21B in 2025, $1.31B in 2026, and $1.81B in 2030—to illustrate an 8.1–8.4% CAGR trajectory compared with mid-single-digit CAGRs in services and tools.[2][6][14]
Give every forecast a five-part check
Check what a forecast counts, when it applies, and whether its numbers reconcile. Read the forecast comparison as a map of reported scopes, baselines, and trajectories—not a ranking of credibility. Apply five checks before using any headline in a budget or investment case.
- Scope: identify the market behind the label.Determine whether the estimate measures professional repair revenue, equipment sales, kits, or broader repair spending. Ask for explicit inclusions and exclusions covering geography, customers, vehicles, and repair methods.The supplied synthesis describes Dataintelo’s PDR forecast as combining labor, tools, and DIY kits. It is therefore not a direct measure of service revenue. Conversely, a services label alone does not establish comparable provider coverage.
- Baseline year: separate the estimate’s year from the report’s date.Record publication or update date, baseline year, and forecast endpoint separately. A report labelled 2026 may contain a 2025 estimate; publication dates do not establish the measurement year.The kits report evidence distinguishes $1.21 billion in 2025, $1.31 billion in 2026, and $1.81 billion in 2030. These belong in separate columns, not one current-market category.As an earlier-year comparison, Intent Market Research starts at $4.3 billion in 2024 and projects $6.8 billion by 2030. Keep that 2024 date visible when discussing 2025 baselines.
- Revenue boundaries: establish what can be added.Ask whether equipment figures measure manufacturer sales or retail spending. For repair estimates, establish how mixed invoices are allocated and whether intermediary transactions repeat underlying repair revenue.The raw synthesis proposes conflicting equipment bands: $2–$4 billion and $3–$5 billion. Neither is a reconciled baseline. The synthesis changes its selected tools range and adds potentially overlapping kit sales.PMarketResearch explicitly includes kits within its tools scope. A tools-plus-kits total therefore requires evidence that the chosen categories are mutually exclusive. Report titles alone are insufficient.
- Growth arithmetic: reproduce the trajectory.Under standard compounding, ending value equals starting value multiplied by
(1 + CAGR)^years. Count annual intervals, not the number of year labels.Marketintelo’s service forecast reportedly rises from $1.8 billion in 2025 to $2.8 billion in 2034 at 5.8% CAGR. Those inputs do not reconcile over nine annual intervals.The stated endpoints imply approximately 5.0% annually. Applying 5.8% instead produces approximately $2.99 billion. These are checks, not corrected publisher estimates. Ask whether the values or forecast period require clarification before relying on the trajectory. - Source independence: count studies, not webpages.Matching numbers may reflect report distribution rather than independent confirmation. Trace each forecast to its original publisher and underlying study before treating repeated appearances as corroboration.The supplied evidence associates matching kits figures with Research and Markets and The Business Research Company. Their independence is not established here. The identified press-release summary should not be counted as separate research.Request sampling details, geographic coverage, estimation methods, and invoice-allocation rules. Arithmetic consistency is necessary but insufficient: a coherent global forecast can still be unsuitable for local planning.
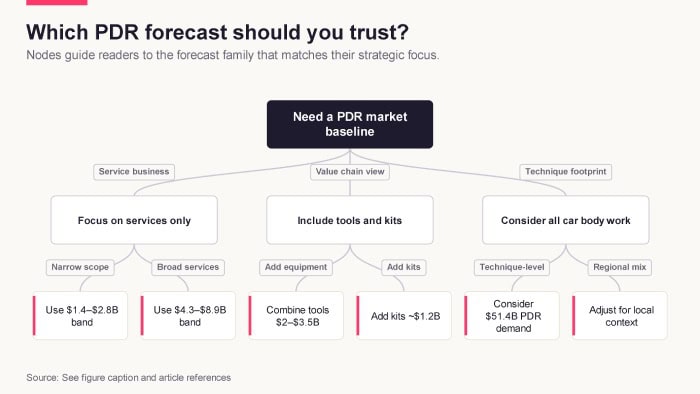
A simple decision guide helps readers choose which PDR market forecast matches their needs by asking whether they care about services only, services plus tools, or the broader car body repair technique footprint. Method: Decision nodes are based on the segment distinctions explained in the report: dedicated PDR services, services plus tools and kits, and technique-level demand inside car body repair; each node recommends using specific report families accordingly.[1][3][5][15][18]
Turn global context into a local operating plan
Build an operating plan from local jobs, not a percentage of global revenue. Global forecasts cannot establish how many customers a Houston technician can profitably serve. Dent Werx is only the supplied research’s local example; no company performance is inferred.
Separate three decisions: expanding service capacity, purchasing equipment, and investing in equipment businesses. Each concerns different revenue and cost drivers. Product-market growth alone does not establish demand for another technician.
The following are proposed planning inputs, not measurements supplied by this research. Track them over a defined period, separating customer types and repair categories where practical:
- Local inquiries: Count genuine requests within the service area, removing duplicates.
- Eligible jobs: Identify damage the business can repair using PDR.
- Booking conversion: Measure the proportion of eligible inquiries becoming bookings.
- Realized prices: Track actual service revenue per completed job, not advertised starting prices.
- Technician capacity: Estimate available repair hours and realistic durations, allowing for non-repair work.
Eligible inquiries multiplied by booking conversion gives expected bookings. Adjust for cancellations and limit completions to available technician capacity. Multiplying completed jobs by expected realized prices estimates service revenue—not profit. Wages, travel, premises, equipment, and other costs require separate budgeting.
Mobile technicians should test route economics before expanding their territory. Track travel and repair time together, then assess revenue against the full time commitment. Mobile paint repair research covers broader cosmetic services and cannot substitute for local PDR bookings.
Specialist shops should identify whether demand or capacity constrains growth. Compare eligible inquiries, booking losses, waiting times, and available technician hours before hiring or adding space. Weak conversion alongside spare capacity warrants investigation of pricing, scheduling, and customer fit.
Body shops should separate PDR from other invoice revenue. Record its work and associated labor apart from repainting or conventional repairs. This makes planning more comparable with dedicated PDR operations and prevents mixed invoices from overstating the relevant revenue.
Tool purchases require a specific operational case. Identify the constraint a tool would remove, then estimate time savings, additional eligible work, or avoided outsourcing. An equipment-market forecast provides context, not evidence that a particular purchase will pay for itself.
Equipment investors need a different assessment: prospective buyers, selling prices, distribution costs, margins, and replacement demand. They should also confirm whether kits already fall within the chosen tools estimate.
Keep incompatible global forecasts separate rather than averaging them into a local growth assumption. Their disagreement can frame uncertainty, but cannot determine Houston booking growth. Nor should a forecast with unresolved arithmetic be treated as an equally validated scenario.
Build conservative, central, and expansion cases by varying local inquiries, conversion, prices, and usable capacity. Label assumptions and update them against operating results. Expansion becomes more defensible when observed demand and economics support it—not when a global headline grows larger.
Choose the right question, not the biggest number
Choose the forecast that matches the decision, not the largest headline. Staffing, equipment inventory, and broader repair-market analysis concern different transactions and require different evidence.
- Service providers need repair-revenue evidence. A services estimate is more relevant than equipment sales, but still requires checks of providers, jobs, geography, and methodology.
- Suppliers need equipment-sales evidence. Tools research can inform manufacturing and distribution questions. Confirm whether kits are already included before combining totals.
- Wider repair figures provide context. Body repair research describes surrounding spending, not revenue automatically accessible to PDR specialists. Its allocation rules must be understood before interpreting segment shares.
Scope explains some disagreement; it does not validate every forecast. Service-labelled estimates still differ substantially, and the supplied methods cannot reconcile their gaps. Selecting a relevant category is therefore the beginning of evaluation, not proof of accuracy.
Keep services, tools, and wider repair activity separate unless compatible definitions justify aggregation. Any combined total needs a clear purpose, aligned years, and explicit treatment of overlap. Otherwise, addition creates apparent scale rather than useful evidence.
The practical sequence is straightforward: define the business question, inspect the forecast, test assumptions locally, and plan for uncertainty. Tie commitments to inquiries, completed jobs, realized prices, costs, and technician capacity. Use alternative demand cases rather than importing a global CAGR into local projections.
Faster kits growth neither guarantees faster technician revenue nor proves displacement by DIY repairs. A useful forecast informs a decision; it does not promise business-level growth.
Limitations
- This analysis checks claims against the supplied research synthesis and source details, not independently inspected report text. Underlying datasets and full methodologies are unavailable.
- Coverage descriptions suggest possible explanations for forecast differences, but do not establish a quantitative reconciliation or identify the most accurate publisher.
- Some reported growth rates do not reconcile with their stated endpoints. Mixed-year comparisons and overlapping tools and kits categories also limit aggregation.
- The accounting boundaries behind broader repair-market shares remain unverified. Derived values should not be treated as independently measured PDR revenue.
- Global forecasts do not establish Houston demand, individual business performance, or achievable investment returns.
References
- Paintless Dent Repair Market Size, Share & Forecast …
- Paintless Dent Repair Kits Market Report 2026
- Car Body Repair Market Research Report 2034
- Top Companies Analysis
- Automotive Paintless Dent Removal Tools Market
- Automotive Paintless Dent Removal Tools Market
- Paintless Dent Repair Service Market – Global Forecast …
- Paintless Dent Repair (PDR) Service Market Size, Share, Trends
- Automotive Paintless Dent Removal Tools Market (2025 – 2034)
- Automotive Paintless Dent Removal Tools Market Size, Share …
- Paintless Dent Repair PDR Service Market Growth Outlook 2035
- Paintless Dent Repair Kits Market Insights Report Analyzing …
- Paintless Dent Repair Services Market Research Report …
- Paintless Dent Repair Service Market Size & Share 2026 …
- Paintless Dent Repair Service Market Forecast to 2031
- Paintless dent repair pdr service Worldwide Market Reports
- Paintless Dent Repair Kits Market Size, Growth Report 2026